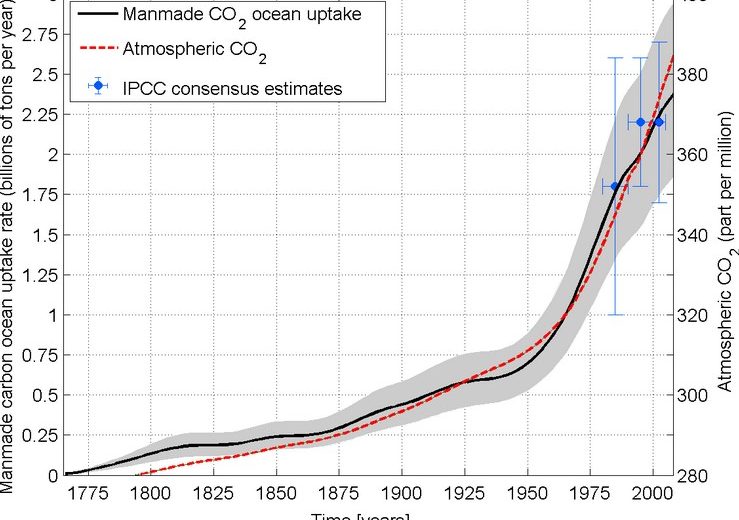
The escalating rate of anthropogenic CO2 emissions during the last 200 years has maintained the disequilibrium between atmospheric carbon fluxes. Figure 6.2 shows how the rate of atmospheric CO2 accumulation (dM/dt) has increased since about 1840. Accompanying this mass accumulation has been a steady and exponential rise in the atmospheric CO2 concentration (Figure 6.3). The CO2 record prior to the late 1950s has been reconstructed from air bubbles trapped in ice cores (section 3.3.2.2). Since then, instrumental monitoring stations have measured concentrations directly.
Table 6.1. Sources and sinks of atmospheric CO2
|
Net Atmospheric CO2 Sources |
||
|
Source |
Sources (Gt/a) |
Uncertainty range (Gt/a) |
|
Fossil fuel/cements (I) |
5.5 |
0.5 |
|
Land-use change (Dn) |
1.6 |
1.0 |
|
Total |
7.1 |
1.1 |
|
Net Atmospheric CO2 Sinks |
||
|
Sink |
Uptake (Gt/a) |
Uncertainty range (Gt/a) |
|
Oceanic uptake (F) |
2.0 |
0.8 |
|
Land biomass (X) |
1.9 |
1.6 |
|
Total |
3.9 |
1.8 |
� Land biomass sink includes uptake by Northern Hemisphere forest regrowth (0.5 0.5 Gt/a) and additional terrestrial sinks including CO2 fertilisation, nitrogen fertilisation and climatic effects (1.4 1.5Gt/a).
Since pre-industrial times, atmospheric CO2 concentration has increased by about 27% from about 290ppm to 359ppm (IPCC, 1995).
Figure 6.4 shows the recent record of CO2 concentrations measured at the Mauna Loa station in Hawaii, since 1958. As well as the obvious upward trend, the record displays a distinct seasonal cycle. Every spring and early summer, the rate of global photosynthesis dramatically increases due to the enhanced growth of Northern Hemisphere terrestrial biomass, in response to elevated levels of insolation. Consequently, atmospheric CO2 concentrations fall several ppm, before recovering in the autumn and winter seasons.


Leave a Reply