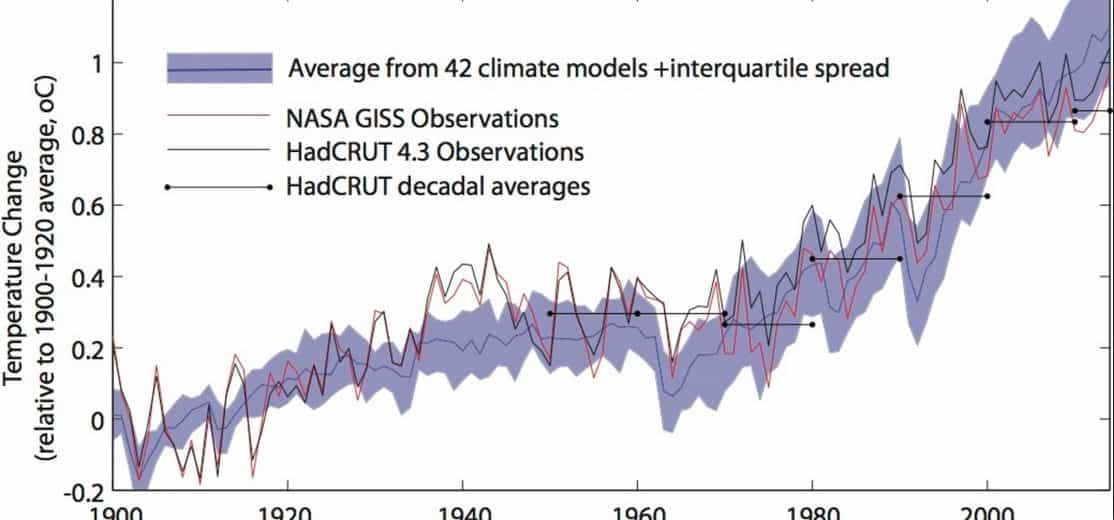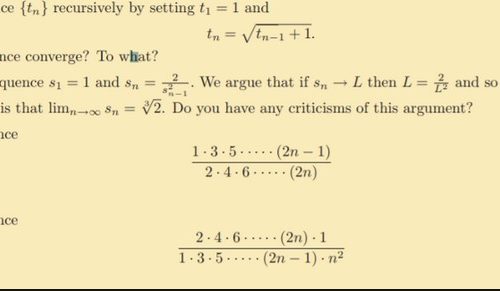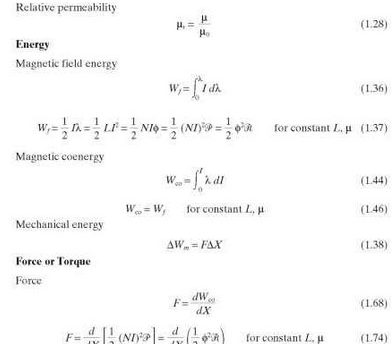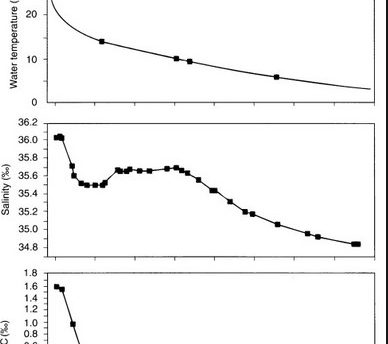
Global-mean temperature has increased by around 0.3 to 0.6C over the past 100 years (section 6.7.1). At the same time, greenhouse gas concentrations, and atmospheric aerosol loadings have increased substantially (sections 6.4 and 6.6). To assess whether the two are associated requires the use of model simulations of the likely climatic effects of the changing atmospheric composition, and the comparison of the results with observations. Three important detection experiments will be discussed here.
Wigley & Barnett (1990) used an energy balance climate model (incorporating upwelling and diffusion within the oceans to account for their radiative damping effect). The model was forced from 1765 to 1990 using only the changes in greenhouse gas concentrations, and the response could be varied by changing the value of the climate sensitivity . In this way, climatic feedbacks (see section 6.9.2), not explicitly modelled, can be incorporated into the model.
The model results were qualitatively consistent with the observations on the century time scale (Figure 6.12). On shorter time scales, the model failed to reproduce the inter-decadal variability of the instrumental record. Indeed, this caveat has often been used as an argument against the greenhouse hypothesis altogether. However, Wigley & Barnett (1990) point out that such variability represents the background noise against which the greenhouse signal has to be detected. Significantly, the observational record seemed to lie at the low climate sensitivity end of the output range of that predicted by GCMs (1.5 to 4.5C). However, the situation becomes more complex if other forcing mechanisms, in addition to the enhanced greenhouse effect, are invoked. If the net century time scale effect of non-greenhouse factors (e.g. solar variability, volcanism) involved a warming, the climate sensitivity would be less than 1C. If their combined effect were a cooling, the sensitivity could be larger than 4C.
One possible explanation for the decadal time scale discrepancies between the model and observed data is that some other forcing mechanism has been operating which has either offset or reinforced the general warming trend at different times. Using another energy balance model, Kelly & Wigley (1992) considered solar variability as a possible candidate. The model was run with a series of sensitivities spanning the accepted range of uncertainty in order to identify the best fit between modelled and observed temperature. Two sets of forcing histories (determined by a 1-D radiative-convective model) were considered, one involving only the effect of enhanced greenhouse gas concentrations (the IPCC 1990 forcing record), the other including also the negative radiative effect of aerosol loading and stratospheric ozone depletion (the IPCC 1992 forcing record).
Table 6.8 summarises the results of Kelly & Wigley (1992). The model explicitly calculated the best fit CO2 doubling temperature (climate sensitivity) and the amount of explained variance in the observational record by each forcing history. As well as IPCC 1990 and 1992 forcing histories, different solar variables (sunspot number, length on sunspot cycle, solar diameter and rate of change of solar diameter) were considered, and combined with the greenhouse forcing.


Leave a Reply